
Python for Data: Clean, Analyse and Visualise
Turn messy spreadsheets into clear answers and charts with Python and pandas — the data skills employers in every industry need.
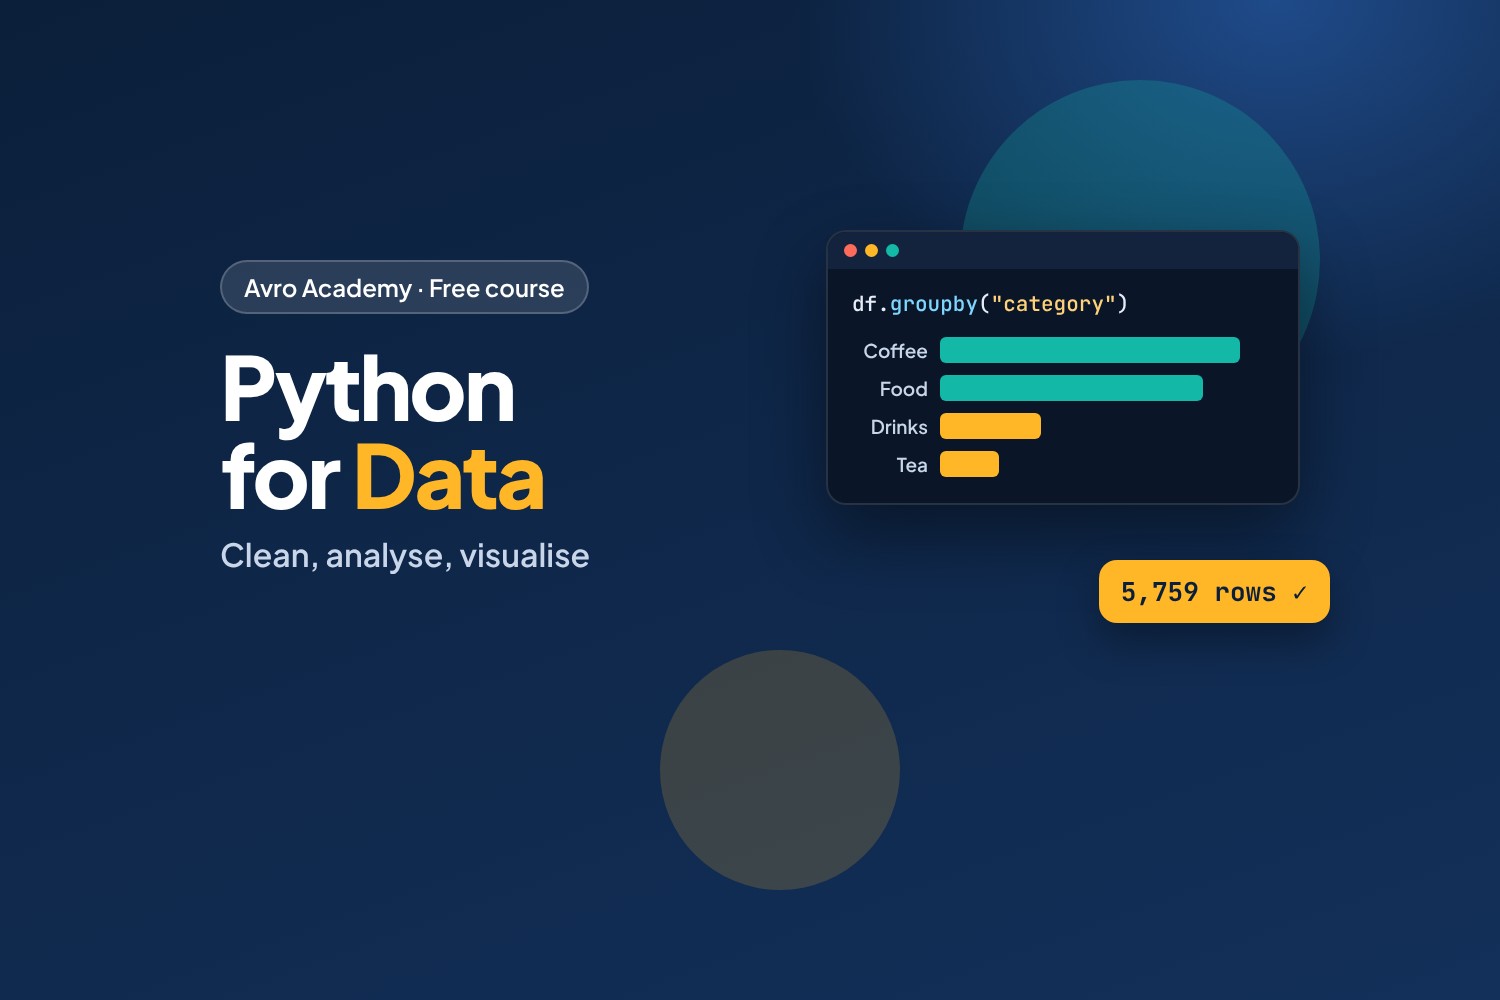
Every business runs on data
Sales, rosters, stock, customers, website visits — every organisation collects data, and most of it is messy. People who can clean it, analyse it and explain it with a chart are valuable in almost any job, not just in tech.
In this course you'll work with a realistic dataset: a full year of sales from a café — nearly 5,900 order lines, complete with the typos, missing values and duplicates you'd find in real life.
What you'll learn
- Load CSV and Excel files into pandas, Python's most popular data tool
- Explore, select, filter and sort data
- Clean messy data: fix text, prices, dates, missing values and duplicates
- Answer questions with group-by, dates, merges and pivot tables
- Make clear, honest charts with matplotlib
- Automate boring jobs: combine many files and export reports to Excel
What you'll produce
- A cleaned version of a messy real-world dataset
- A weekly roster-hours report generated automatically from several files
- A capstone analysis of a year of café sales, with charts and written findings
Before you start
You'll need the basics from Python Foundations (variables, lists, loops, functions and dictionaries) and a free Google account for Google Colab — nothing to install.
How it works
- 7 modules, 23 lessons, about 6 hours plus practice
- A ready-to-run Colab notebook for every module, plus the datasets
- Every result in the lessons comes from really running the code — you'll get the same numbers
- Exercises with solutions, a quiz after each module, and a certificate
Free forever — like every self-paced course on Avro Academy: all lessons, quizzes, downloads and your certificate. Our promise
Course outline
Module 1: Data with Python
What data work is, Colab for data, and plain Python versus pandas.
- What data work really isFree preview10 min
- Colab for data: notebooks and uploading files12 min
- Data with plain Python firstFree preview15 min
- Module 1 quiz5 min
Module 2: pandas basics
DataFrames, exploring, selecting, filtering, sorting and new columns.
- DataFrames: loading CSV and Excel15 min
- Exploring your data15 min
- Selecting and filtering15 min
- Sorting and new columns12 min
- Module 2 quiz5 min
Module 3: Cleaning messy data
Finding problems, fixing types, tidying text, missing values, duplicates and saving a clean file.
- Finding the problems12 min
- Fixing types: prices, numbers and dates15 min
- Text, missing values, duplicates — and saving20 min
- Module 3 quiz5 min
Module 4: Analysing
groupby, dates, merge and pivot tables.
- groupby: totals by category, item and staff15 min
- Working with dates: months and weekdays15 min
- Combining tables with merge15 min
- Pivot tables12 min
- Module 4 quiz5 min
Module 5: Visualising
Bar, line and histogram charts, choosing the right one, and honest charts.
- Bar and line charts15 min
- Histograms and choosing the right chart12 min
- Honest charts12 min
- Module 5 quiz5 min
Module 6: Automating everyday tasks
Combining many files, exporting to Excel, and a roster report that writes itself.
- Combining many files at once15 min
- Exporting reports to Excel and CSV12 min
- Project: weekly roster hours report20 min
- Module 6 quiz5 min
Module 7: Capstone and next steps
Analyse a year of café sales, work with real open data responsibly, and plan your next steps.
- Capstone: a year at Corner Café30 min
- Real data: open datasets, privacy and ethics12 min
- Next steps in data10 min
- Module 7 and final quiz5 min